How to use the NSW Threatened Species & Communities web tool
Who should use this website?
This website will be of use to managers of, or other parties interested in, threatened species and ecological communities and their threats at regional to state wide (NSW) spatial scales.
Click on the links below to guide you on how to use this website:
How to find where a threatened species occurs in NSW, and view its profile
How to find a list of NSW threatened species by taxa (type), family or genus
How to find where a NSW threatened ecological community occurs, and view its profile
How to find a list of NSW threatened ecological communities
How to find Saving our Species management sites for a particular species
How to view Saving our Species management sites against current environmental variables
How to find where a threatened species occurs in NSW, and view its profile
Note: whilst there is the capacity to sort by common name, many species have several common names, so searching by scientific name often provides the best result.
As an example, to view the profile of the threatened frog, Mahony's Toadlet (Uperoleia mahonyi), and to find where it occurs:
1. Click on the Species icon on the home page.
2. Begin by typing the name of the species (common or scientific) until a drop-down box of names appears, including the species' name (i.e. Mahony's Toadlet). Click on the species' name in the drop down box. Note that the scientific name of the species also appears. Alternatively, click on the List all species tab and find the species' name in the drop-down list. Note that the lists (species name, common name, type, family, and status), can all be re-sorted alphabetically (A to Z and Z to A) by clicking on the arrow to the right of the column heading. Click on the species' name (i.e. Uperoleia mahonyi).
3. The profile page of the species then appears (Figure 1). The profile contains images of the species and provides information on its taxonomy, threat status, habitat, and distribution, and also lists the SOS management stream the species belongs to. Known threats to the species are also listed, and these are separated into 'climate change' threats and 'other' threats. Links to additional information sources are also provided.
4. A map of known occurrences (yellow dots) is provided at the bottom of the profile page. Note that in some cases, sensitive location information is withheld.
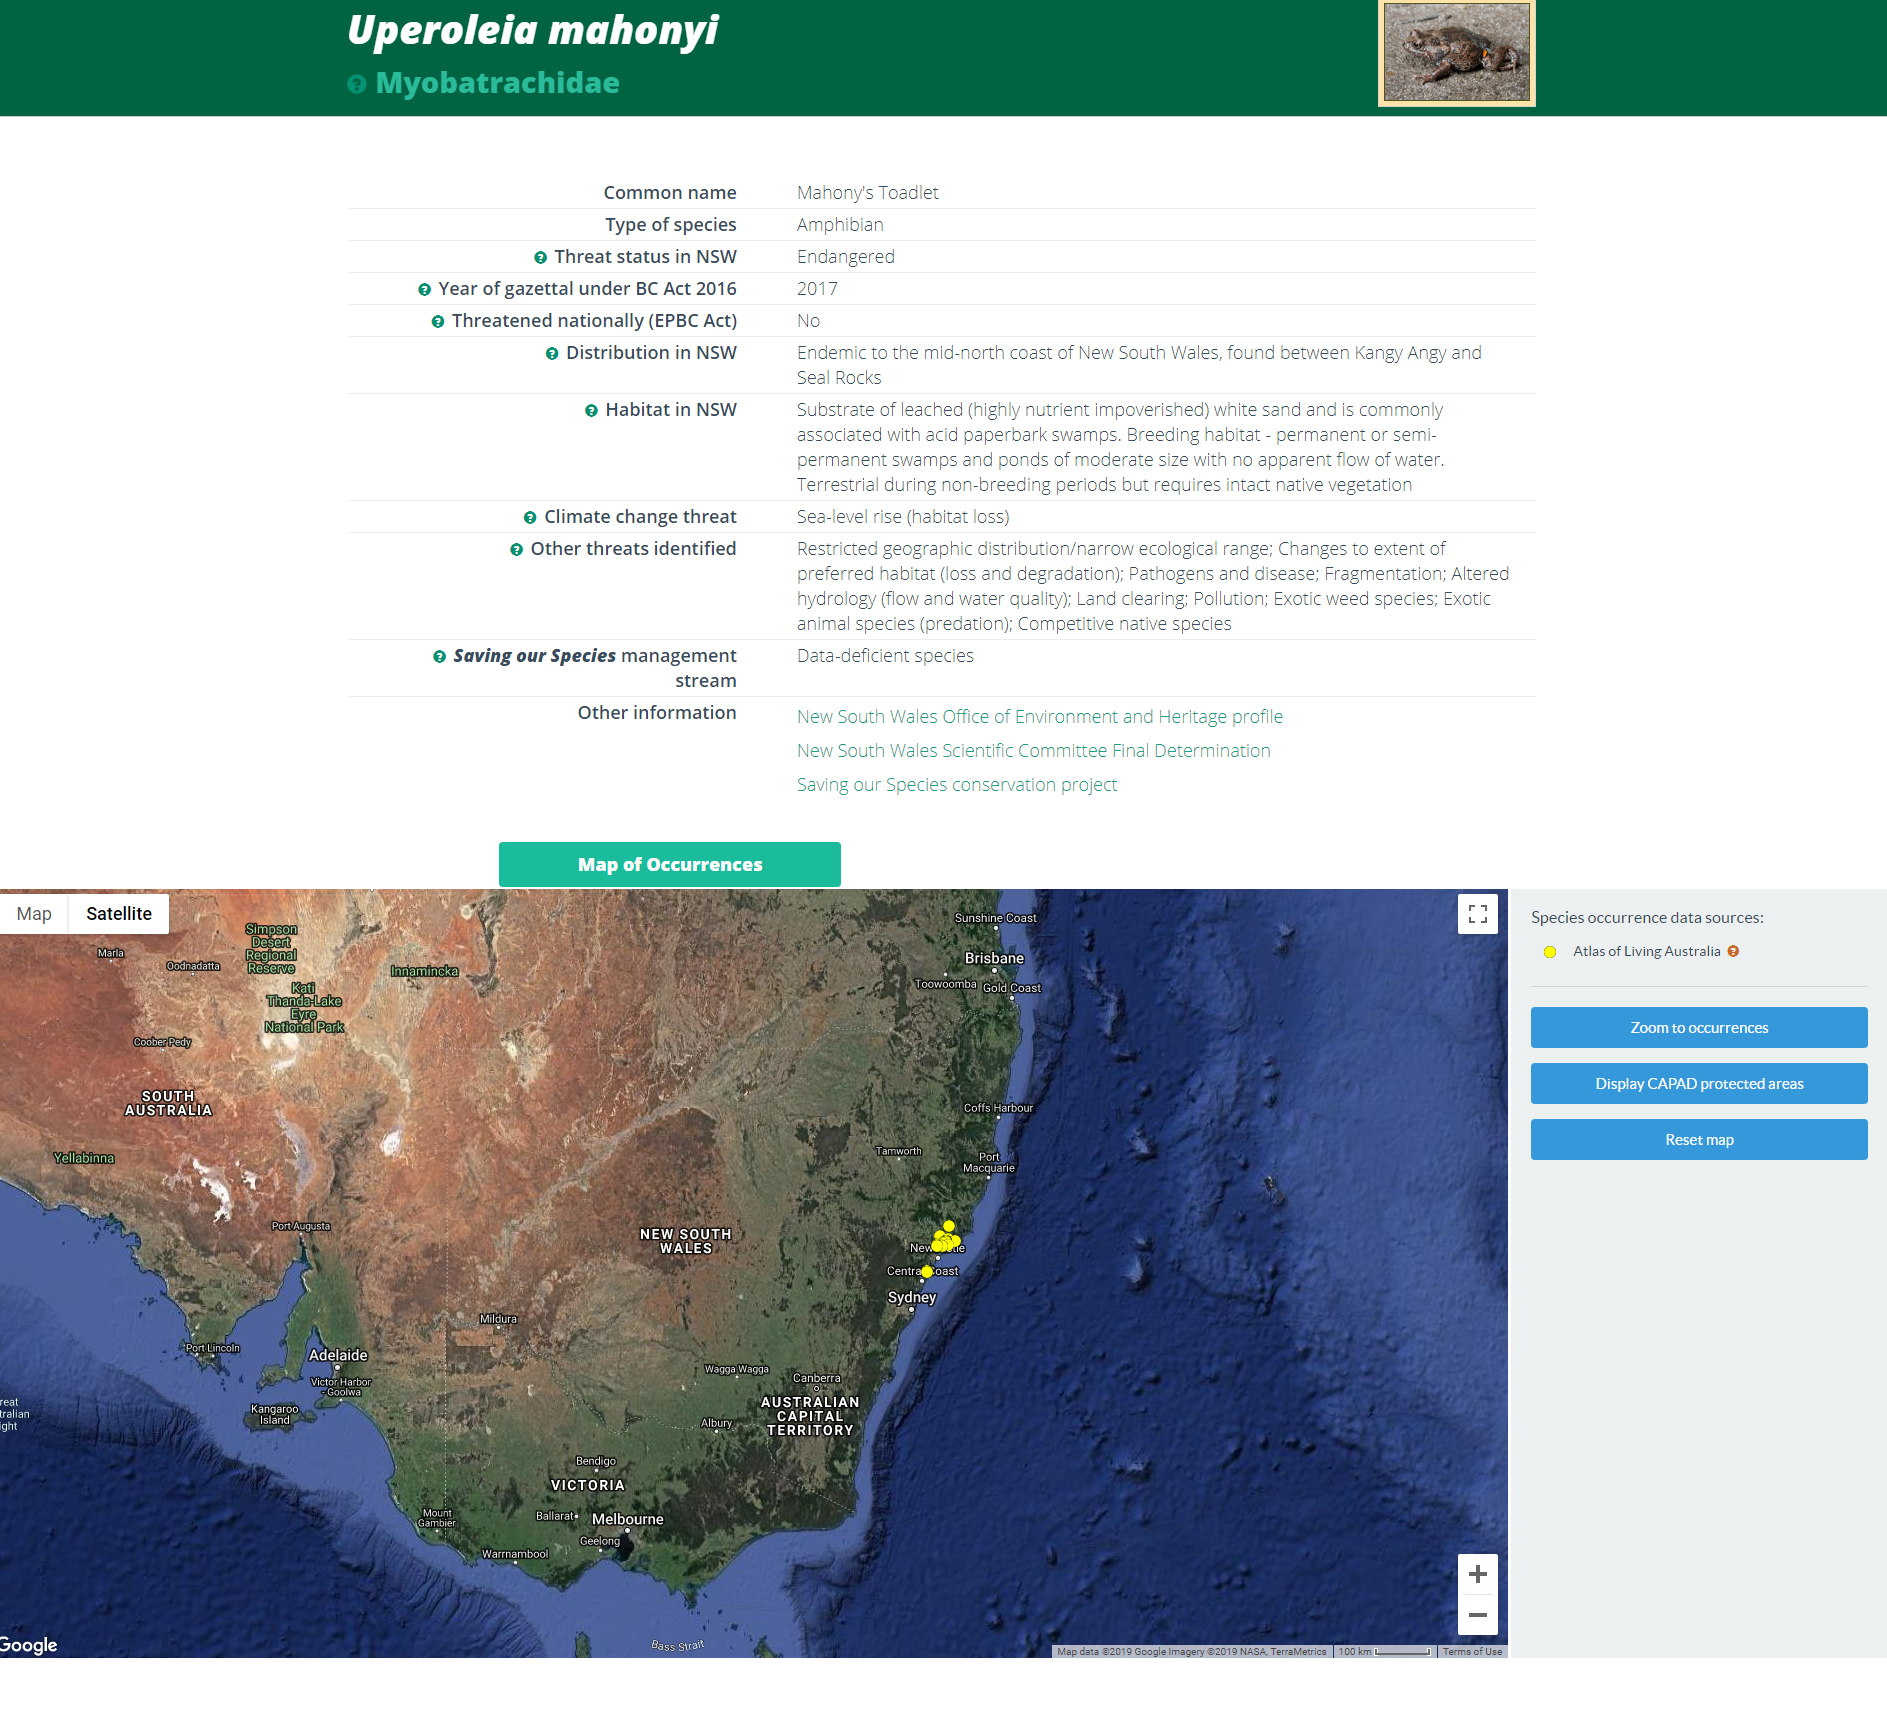
Figure 1. Profile page for Uperoleia mahonyi
5. To change the scale of the map, either double click on the map and drag the mouse around, or click on the zoom to occurrences tab to view occurrences at a magnified scale. By clicking on the square in the top right corner of the map, the map can be viewed at full screen. Click on the reset map tab to return to the original scale. You can toggle between map or satellite display.
6. Click on the Display CAPAD protected areas tab to determine if the occurrences are within protected areas. This function takes a short while but an overlay of protected areas will appear. Hover over each coloured area to see the name (and type) of the protected area (see the Glossary for further information on CAPADs).
How to find a list of NSW threatened species by taxa (type), family or genus
As an example, to see which frogs are listed as threatened in NSW:
1. Click on the species icon on the home page.
2. Click on the List all species tab.
3. Go to the Type column and sort the column alphabetically (A to Z or Z to A) by clicking on the down arrow next to Type. In this example, sort by A to Z for amphibians. A list of threatened amphibians, sorted alphabetically, will appear (Figure 2).
To view a list of species by genus, family or threat status (i.e. vulnerable, endangered, critically endangered), complete the steps above using the appropriate column.
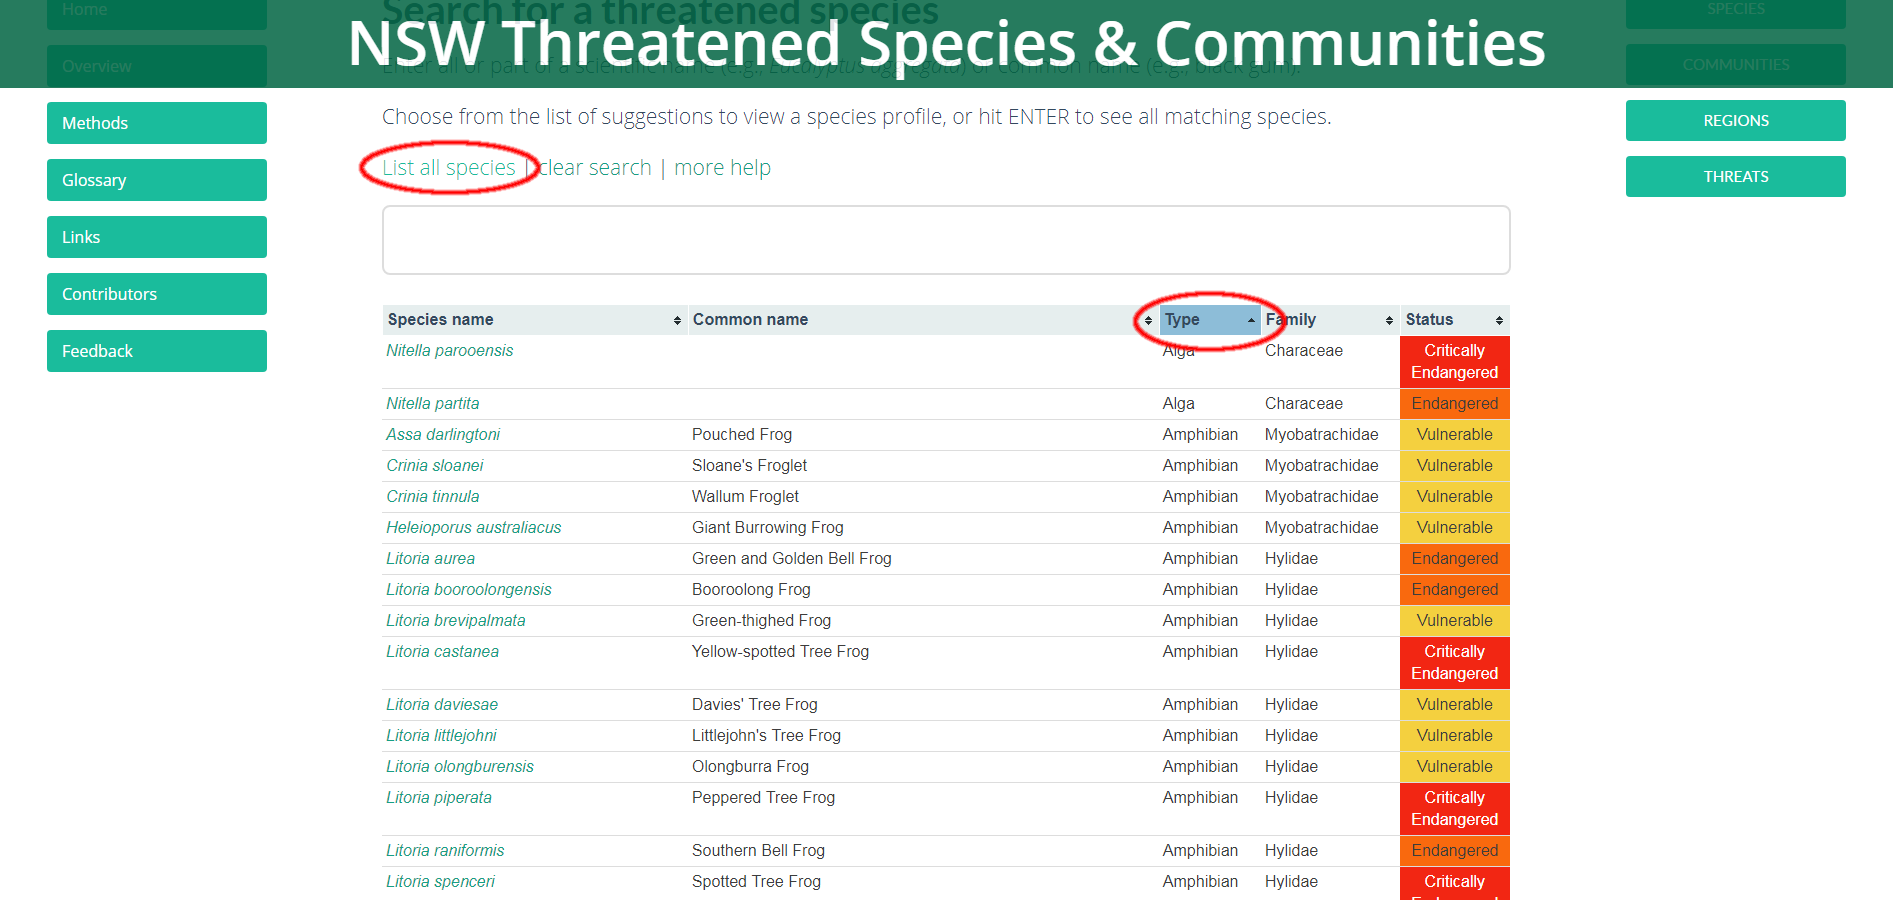
Figure 2. List of threatened species, sorted by Type
How to find where a NSW threatened ecological community occurs, and view its profile
As an example, to view the profile of the Blue Gum High Forest in the Sydney Basin Bioregion, and to find where it occurs:
Click on the Communities icon on the home page.
1. Begin by typing the name of the community until a drop-down box of names appears, including the community's name (i.e. "blue gum"). Alternatively, click on the List all communities tab (Figure 3). Names can be re-sorted alphabetically (A to Z and Z to A) by clicking on the arrow next to Community name. Scroll down and click on the community.
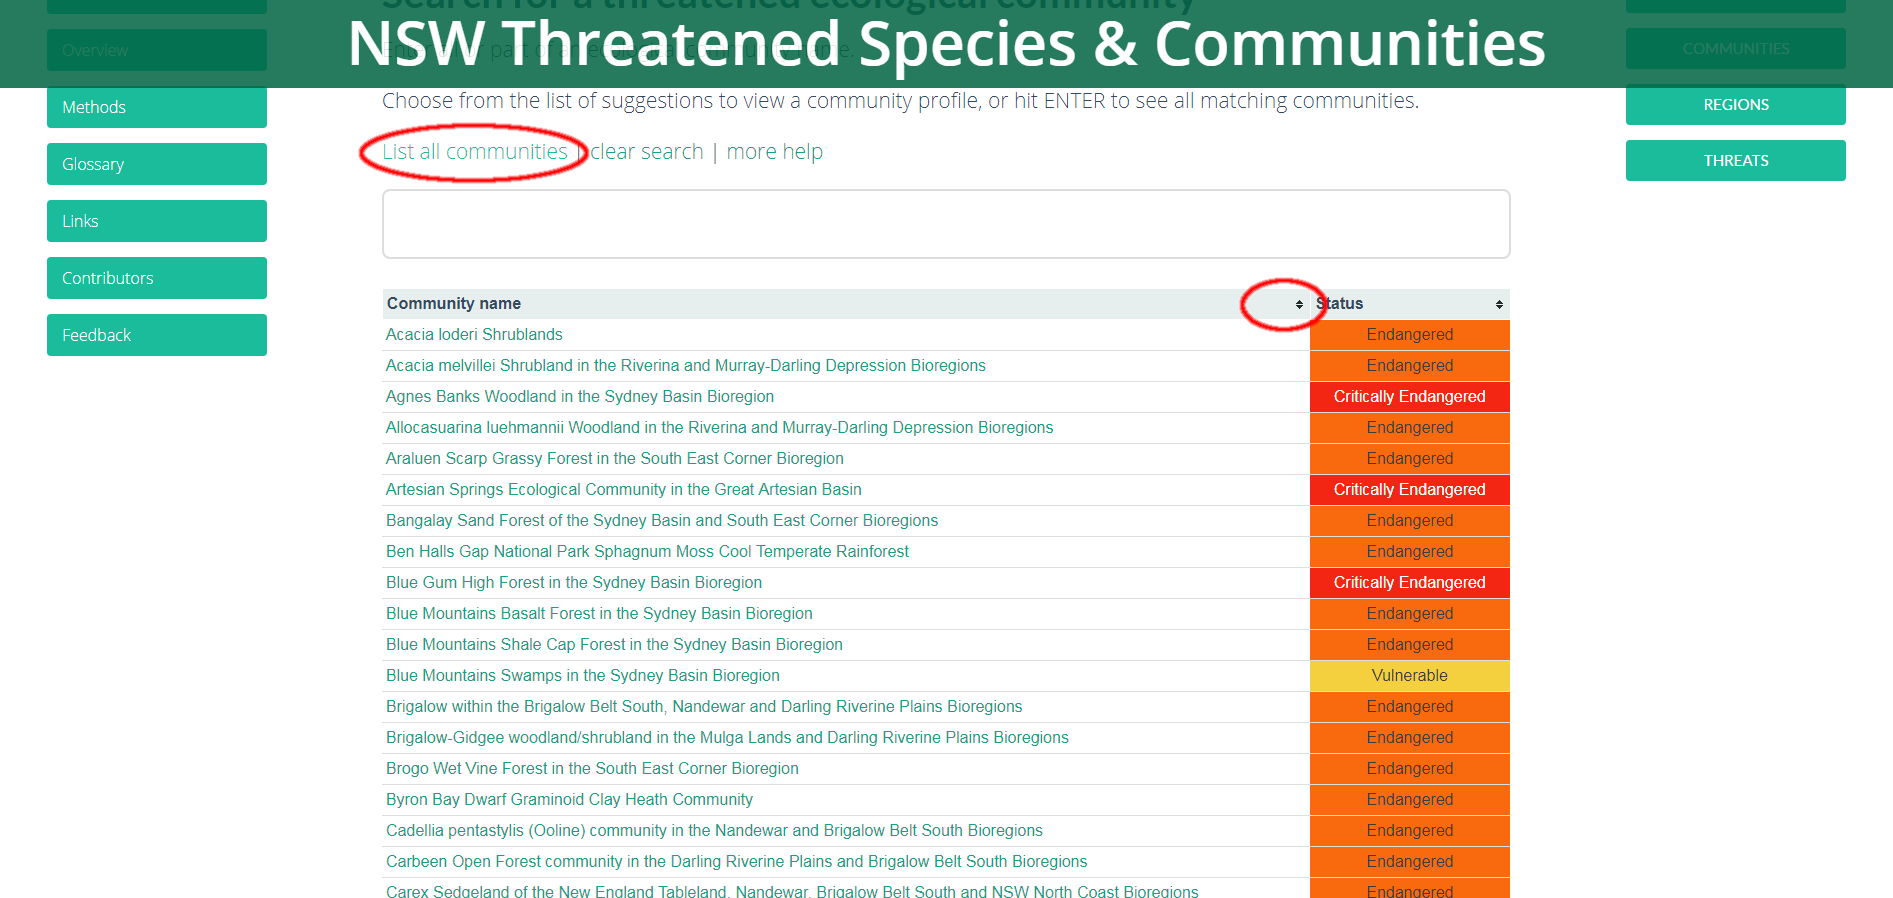
Figure 3. List of threatened ecological communities
2. The community's profile page will appear. The profile includes a description of the community and provides information on its threat status, year of gazettal, location within IBRA regions and LGAs, and links to other sources of information. The threats to the community are also listed and are separated into 'climate change' threats and 'other' threats.
3. A map showing the location of the community is found at the bottom of the profile (Figure 4). Note that in some cases, sensitive location information is withheld.
4. To change the scale of the map, either double click on the map and drag the mouse around, use the + or - symbols at the bottom of the map, or click on the square in the top right corner to view the map at full screen. Toggle between map or satellite to change the display.
5. To view the IBRA regions or LGAs that the community has been recorded in, use the drop-down box at the top of the map. Hover the mouse over the region (highlighted in green) and the name will appear in the box at the top of the map.
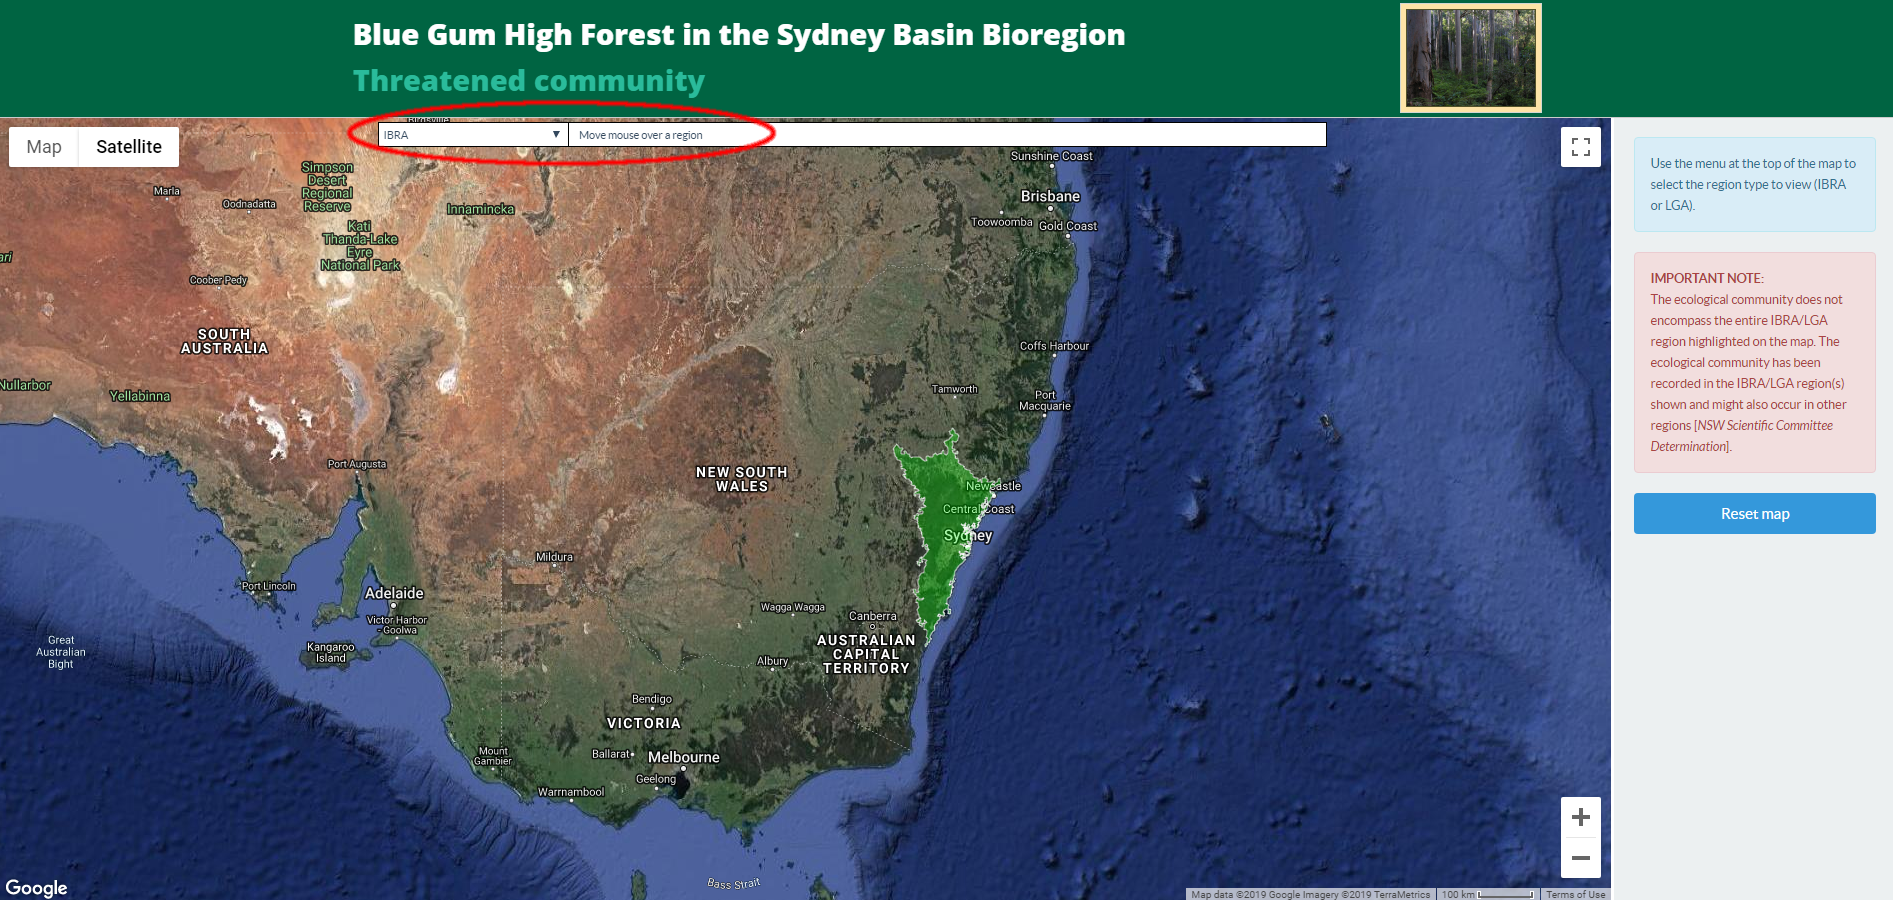
Figure 4. Map showing location of Blue Gum High Forest threatened ecological community
How to find a list of NSW threatened ecological communities
Click on the Communities icon on the home page.
Click on the List all communities tab (Figure 5). Names can be re-sorted alphabetically (A to Z and Z to A) by clicking on the arrow next to Community name. Scroll down to view all.
Figure 5. List of threatened ecological communities
How to find Saving our Species management sites for a particular species
As an example, to view the list of Saving our Species management sites for the Southern Brown Bandicoot, follow the instructions under How to find where a threatened species occurs in NSW, and view its profile (using Southern Brown Bandicoot as the species of interest) (Figure 6).
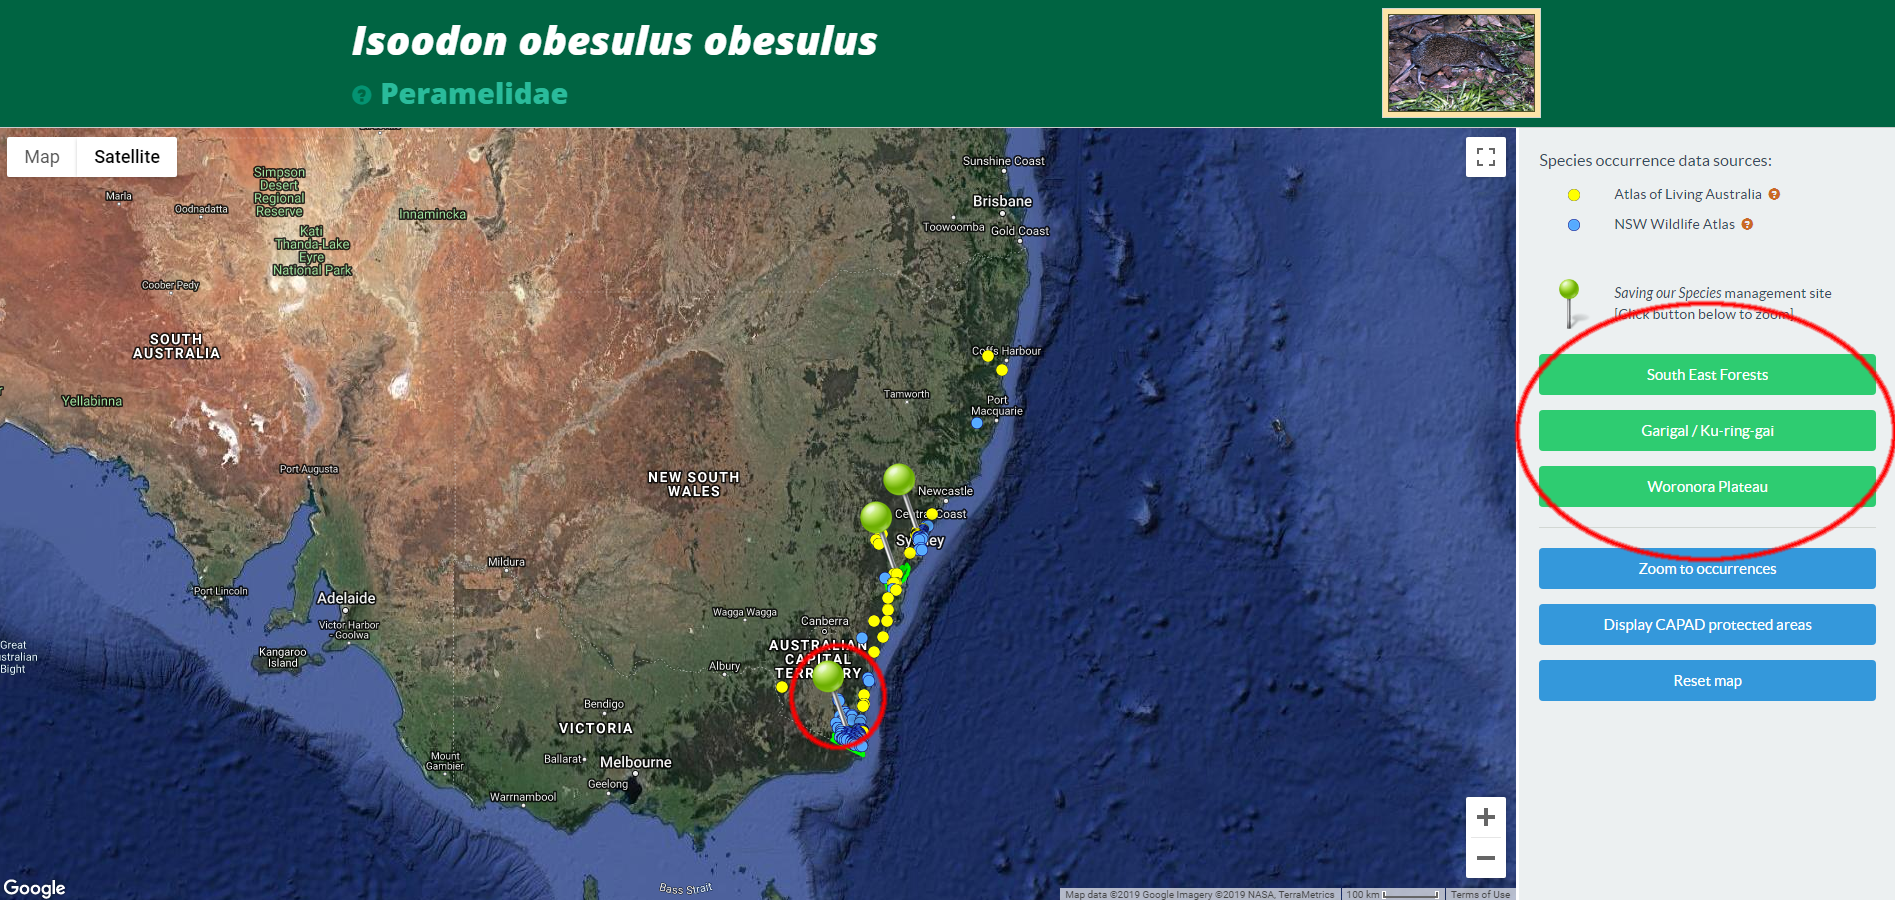
Figure 6. Profile page for Isoodon obesulus obesulus (Southern Brown Bandicoot)
The management sites are listed in green tabs on the right-hand side of the map and are also marked on the map with green pins. Click on the green tabs to view occurrences within a particular management site.
How to view Saving our Species management sites against current environmental variables
Occurrences (within and outside of SOS management sites) can be plotted against environmental variables. This data can help to assess whether the SOS management sites adequately cover the entire range of the species' distribution.
For example, to see how representative the SOS management sites for Eucalyptus aggregata are in relation to annual precipitation:
Follow the instructions under How to find where a threatened species occurs in NSW, and view its profile (using Eucalyptus aggregata as the species of interest).
1. Click on the Environmental Data tab, located above the map (Figure 7).
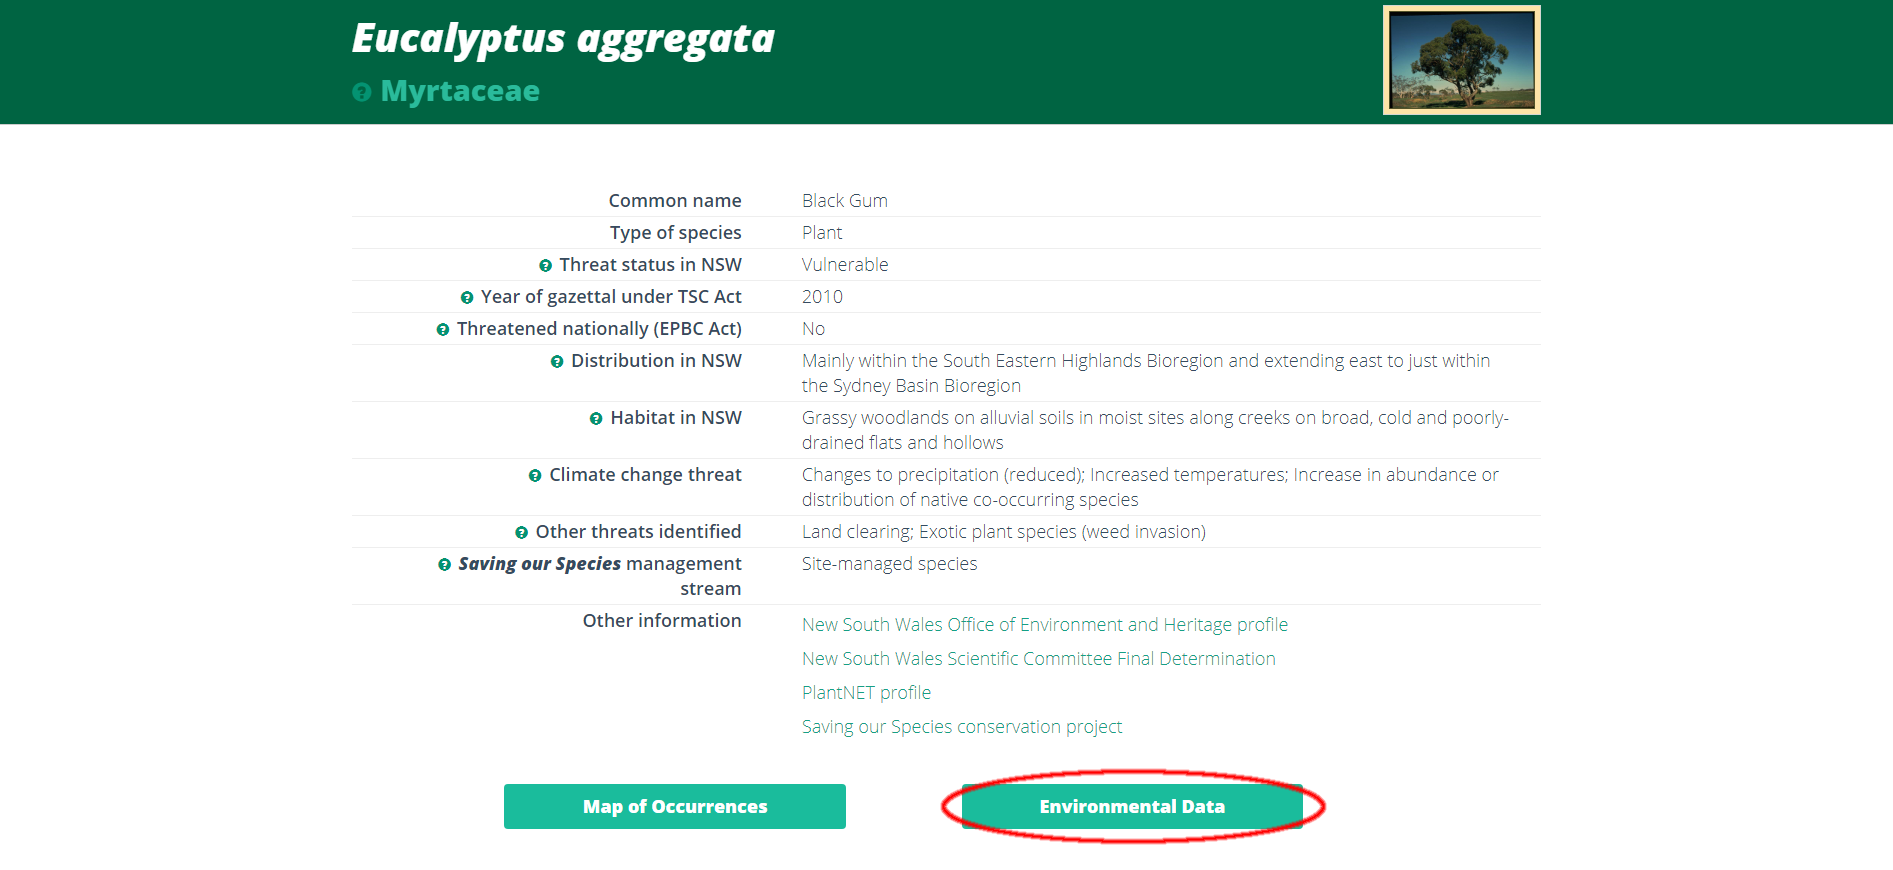
Figure 7. Species profile page for Eucalyptus aggregata
2. Under X-axis variable, click on Annual mean temperature and a drop-down box of environmental variables appears. To view a different variable, i.e. annual precipitation, select Annual precipitation. The histogram shows the spread of annual precipitation across the recorded occurrences. Occurrences within SOS management sites are shown in green (Figure 8).
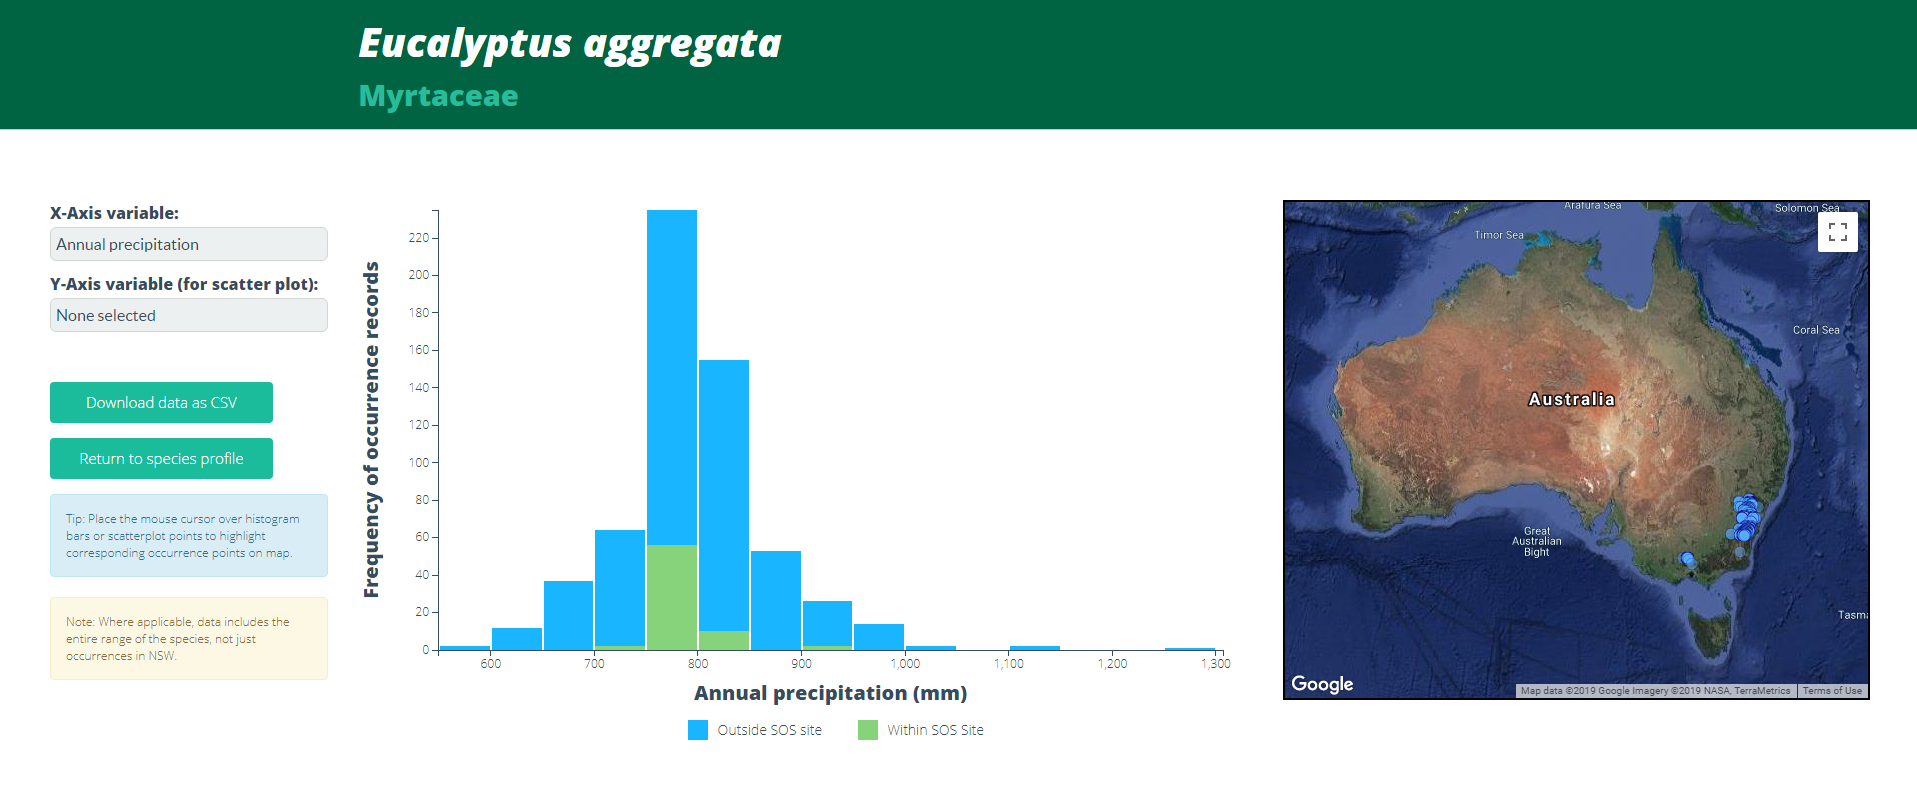
Figure 8. Environmental data page for Eucalyptus aggregata
To view the species' current climate envelope, a scatterplot of two variables can be produced by selecting another variable for the Y-axis. The below example is for Annual mean temperature and Annual Precipitation. Occurrences within SOS management sites are green (Figure 9).
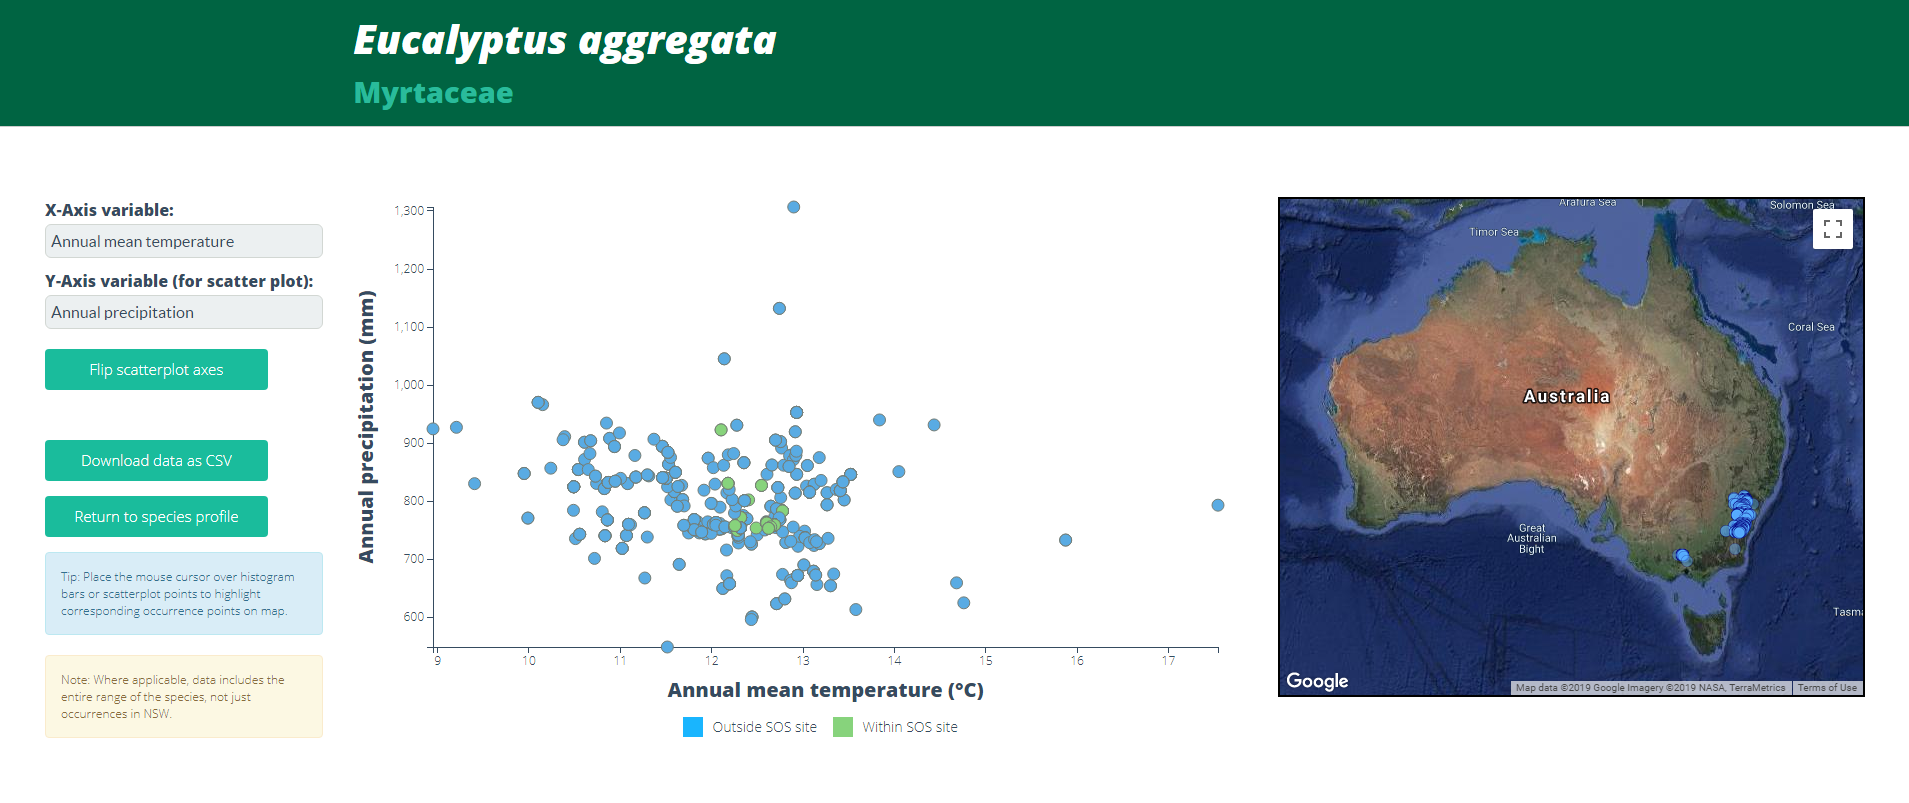
Figure 9. Scatterplot of environmental data for Eucalyptus aggregata
How to view a list of threatened species and/or communities (and their threats) found in a particular region
As an example, to view the list of threatened species in the Hay LGA:
On the home page, click on the Regions icon.
Begin by typing the name of the region (i.e. "Hay") until a drop-down box appears, including the region. Click on the region. The location of the Hay LGA is then shown on a map (Figure 10).
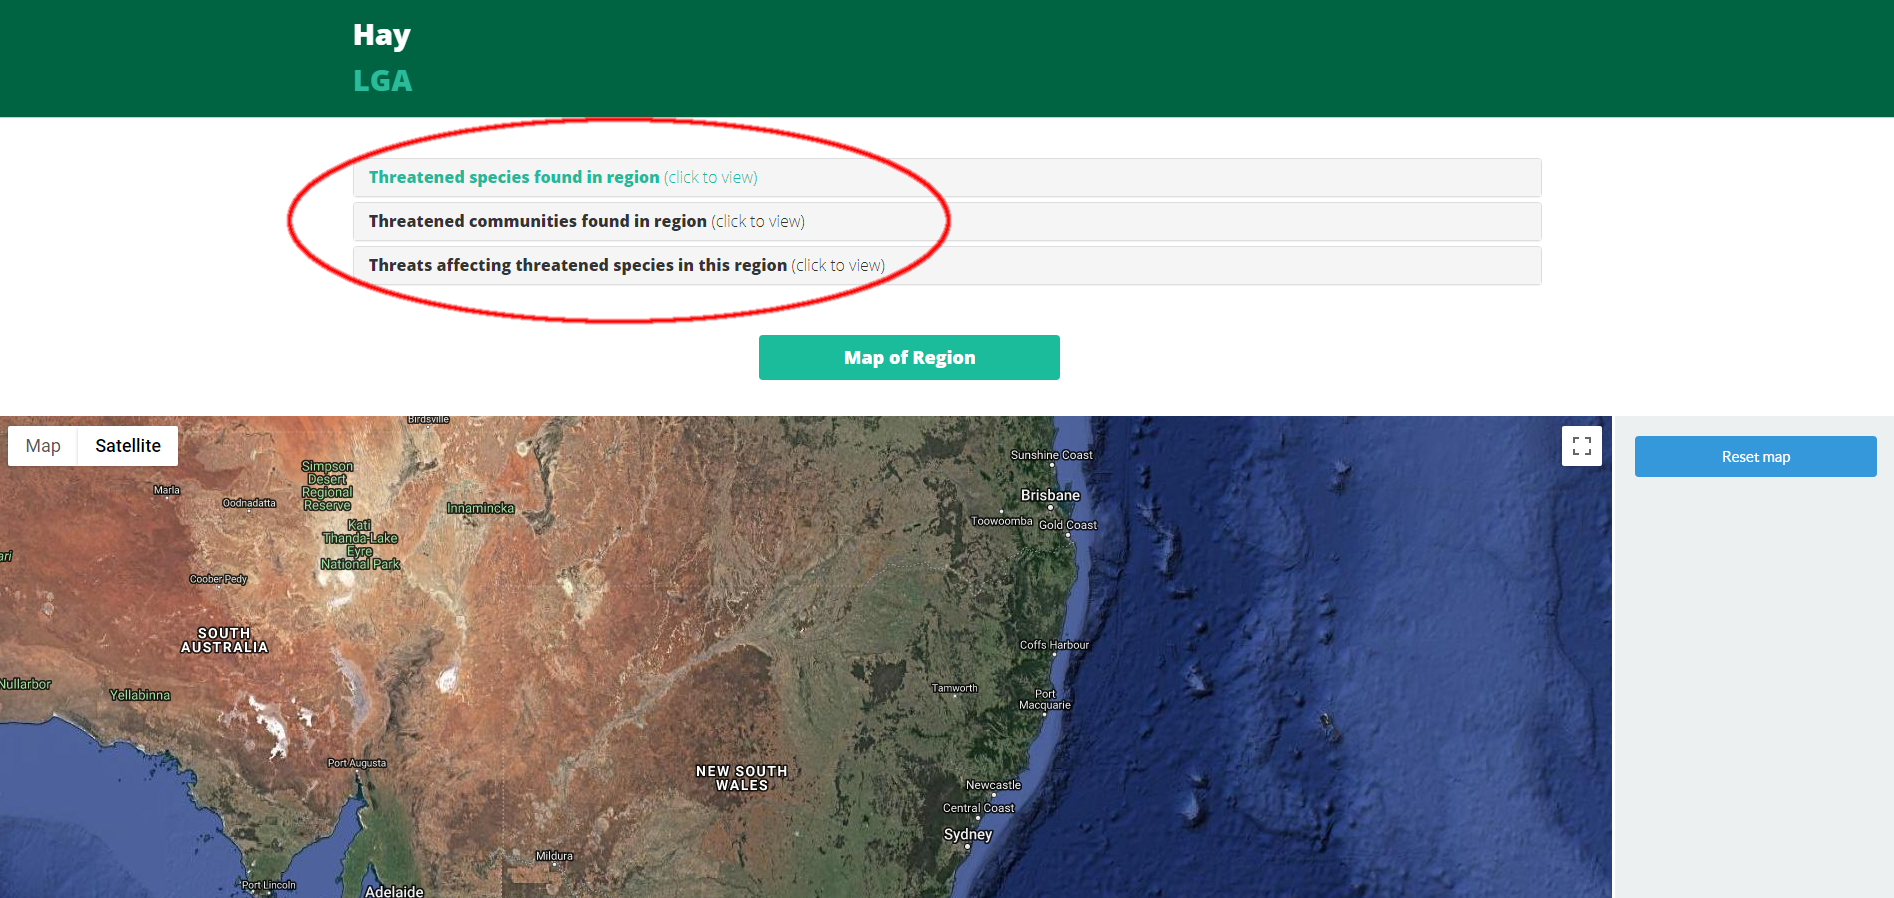
Figure 10. Region page for the Hay LGA
1. Click on the Threatened species found in region tab.
A list of threatened species, along with their threat status is shown. Click on a species to visit the profile page.
2. Click on the Threatened communities found in region tab.
A list of threatened communities, along with their threat status is shown. Click on a community to visit the profile page.
3. Click on the Threats affecting threatened species in this region tab.
A list of threats in the region, and the species affected by those threats, is shown. Click on a species to visit the profile page.
How to view a map of IBRA, LLS, CAPAD or LGA regions/areas
On the home page, click on the Regions icon.
1. Begin by typing the name of the region (i.e. "Hay") until a drop-down box appears, listing any regions of interest with that name and the region type. Click on the region. A map of the region is then shown.
2. Alternatively, click on the Regions icon and then click on view a map of regions in NSW (Figure 11).
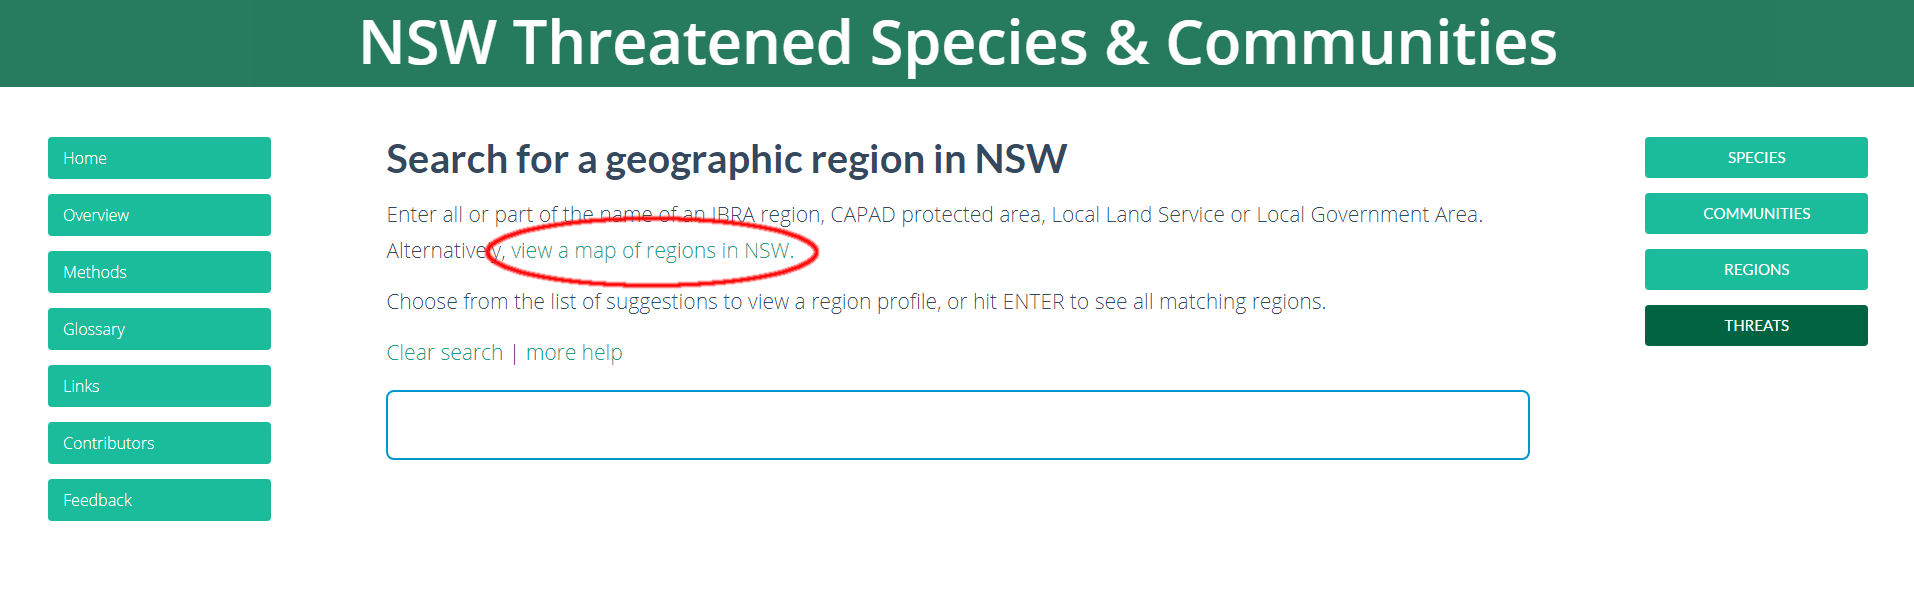
Figure 11. Regions page
3. Use the drop-down box at the top of the map to select between IBRA, LGA or LLS (Figure 12). Hover over the map, and the name of the region is shown in the box at the top of the map. Click on the region you are interested in.
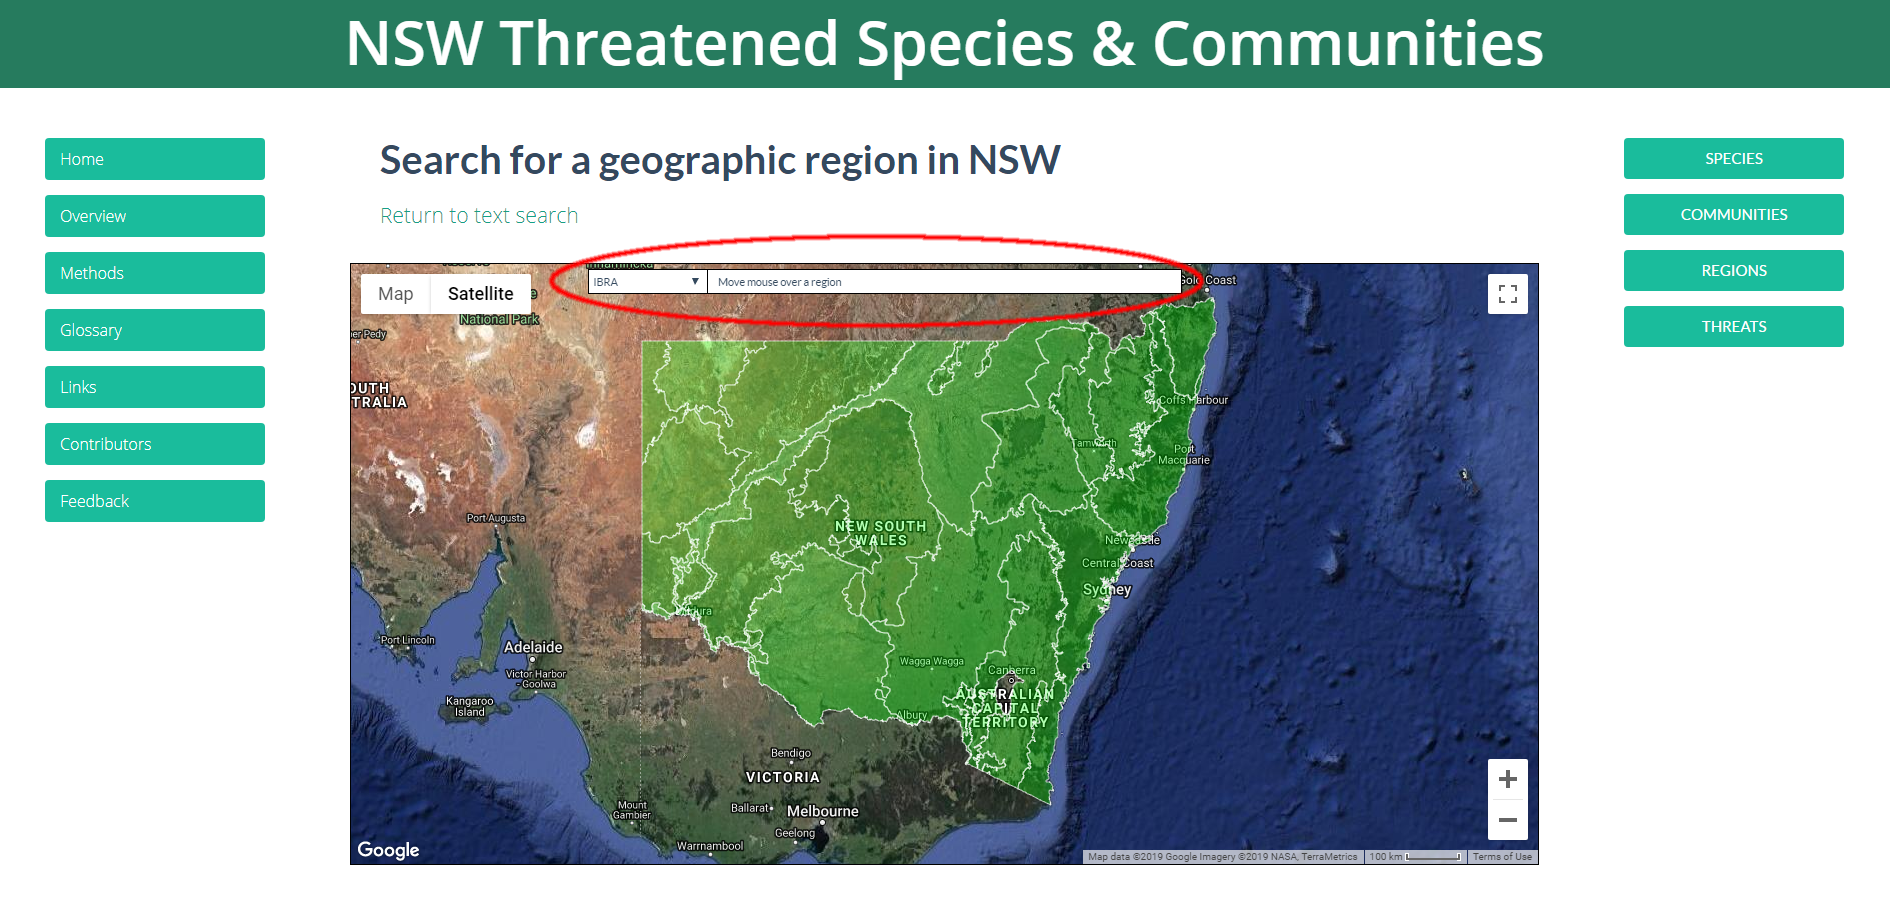
Figure 12. Geographic regions in NSW
How to search by threat type
On the home page, click on the Threats icon.
Either type in the threat type in the empty search box or search under climate change threats or other threats.
For example, to see which threatened species and ecological communities have sea-level rise documented as a threat, either:
1. Begin to type "sea-level" in the empty search box (Figure 13).
2. Sea-level rise is listed five times with different sub categories. Select the appropriate subcategory i.e. "habitat loss".
3. A list of threatened species and ecological communities affected by this threat will appear on the next page (Figure 14).
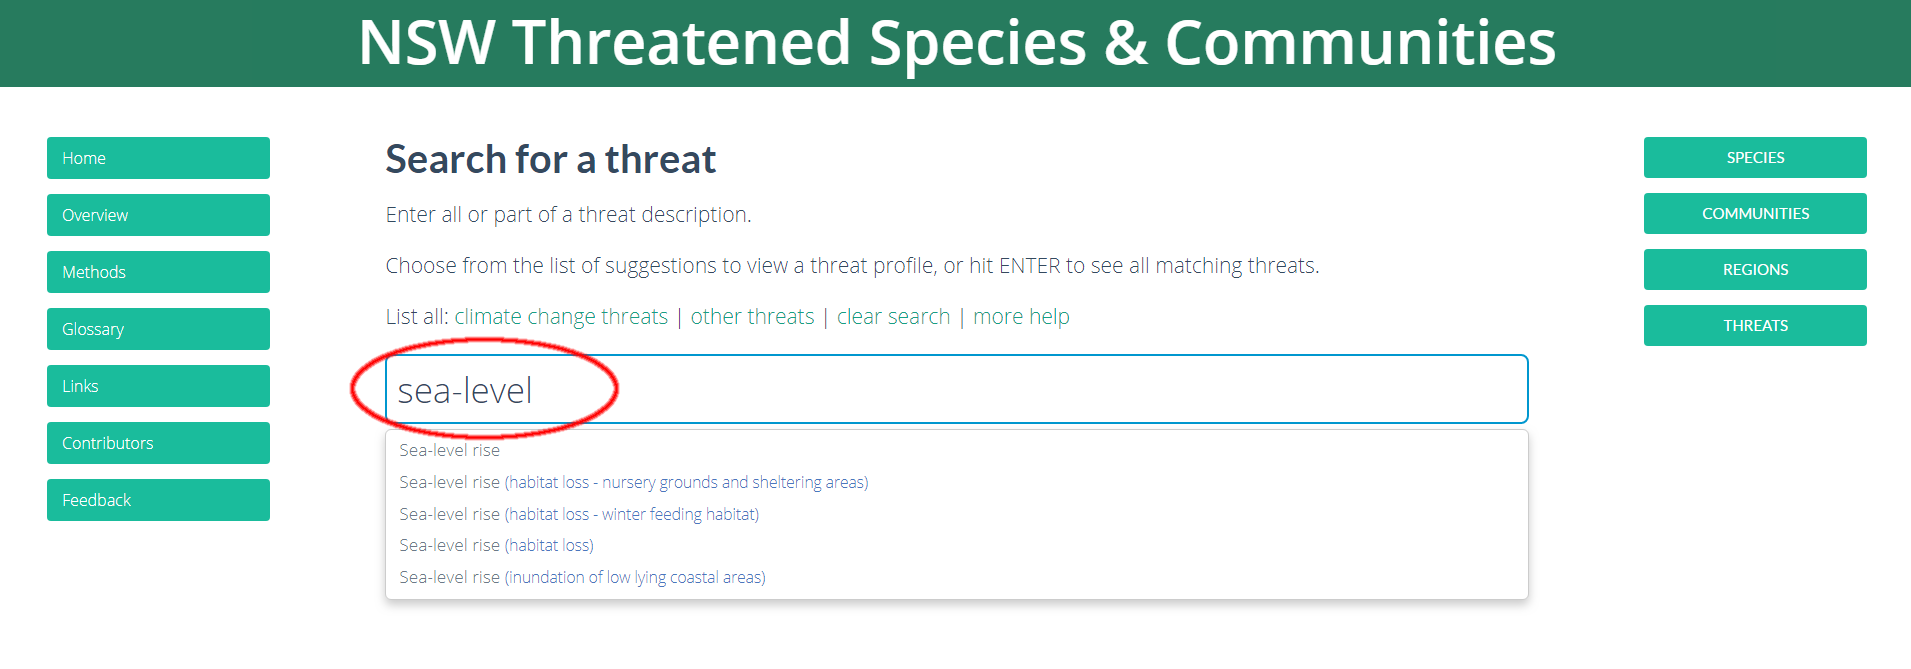
Figure 13. Threat search for "Sea-level rise (habitat loss)"
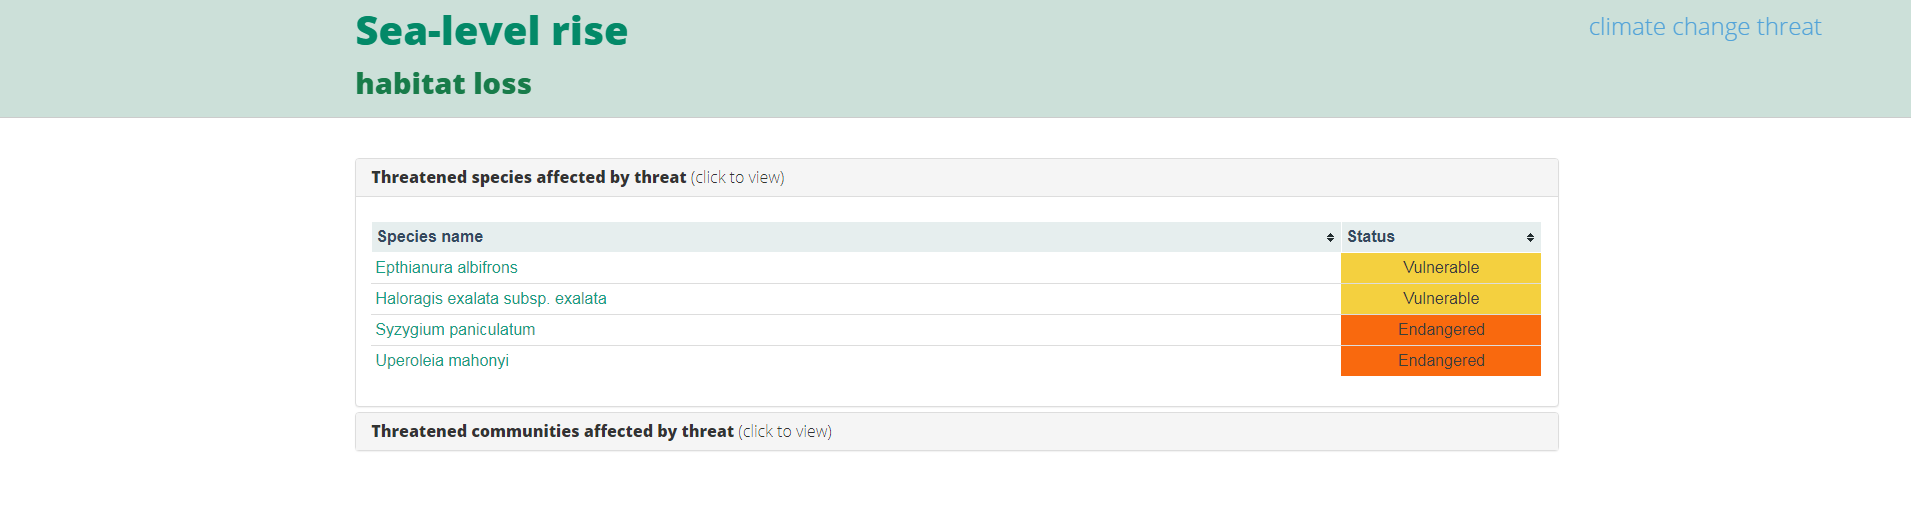
Figure 14. List of threatened species that have "Sea-level rise (habitat loss)" identified as a threat
or:
Click on list all climate change threats and the threats are listed by Category, Detail, and Type on the next page (Figure 15). Scroll down the Threat category column to "Sea-level rise". "Sea-level rise" is listed five times with different information in the Threat detail column (Figure 16).
There are five different types of detail listed. Click on any of the green text to see a list of species and/or communities affected by this threat. Click on a species or community to go to the profile page.
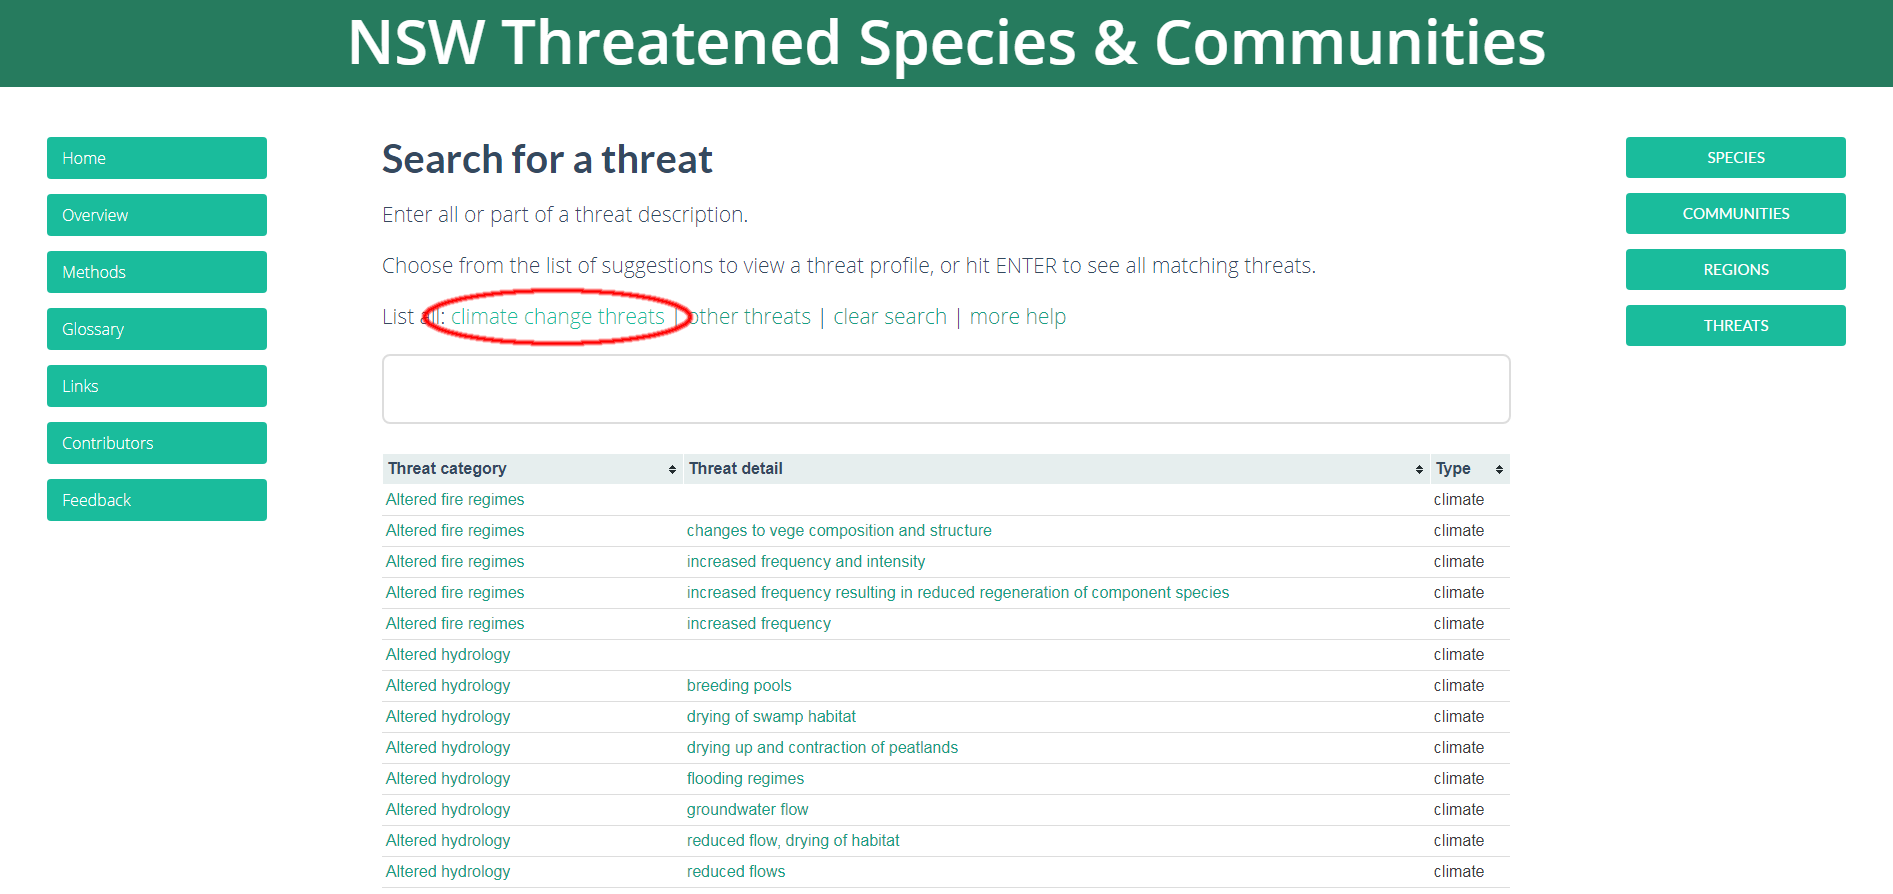
Figure 15. List of climate change threats. Scroll down the list to see all climate change threats.
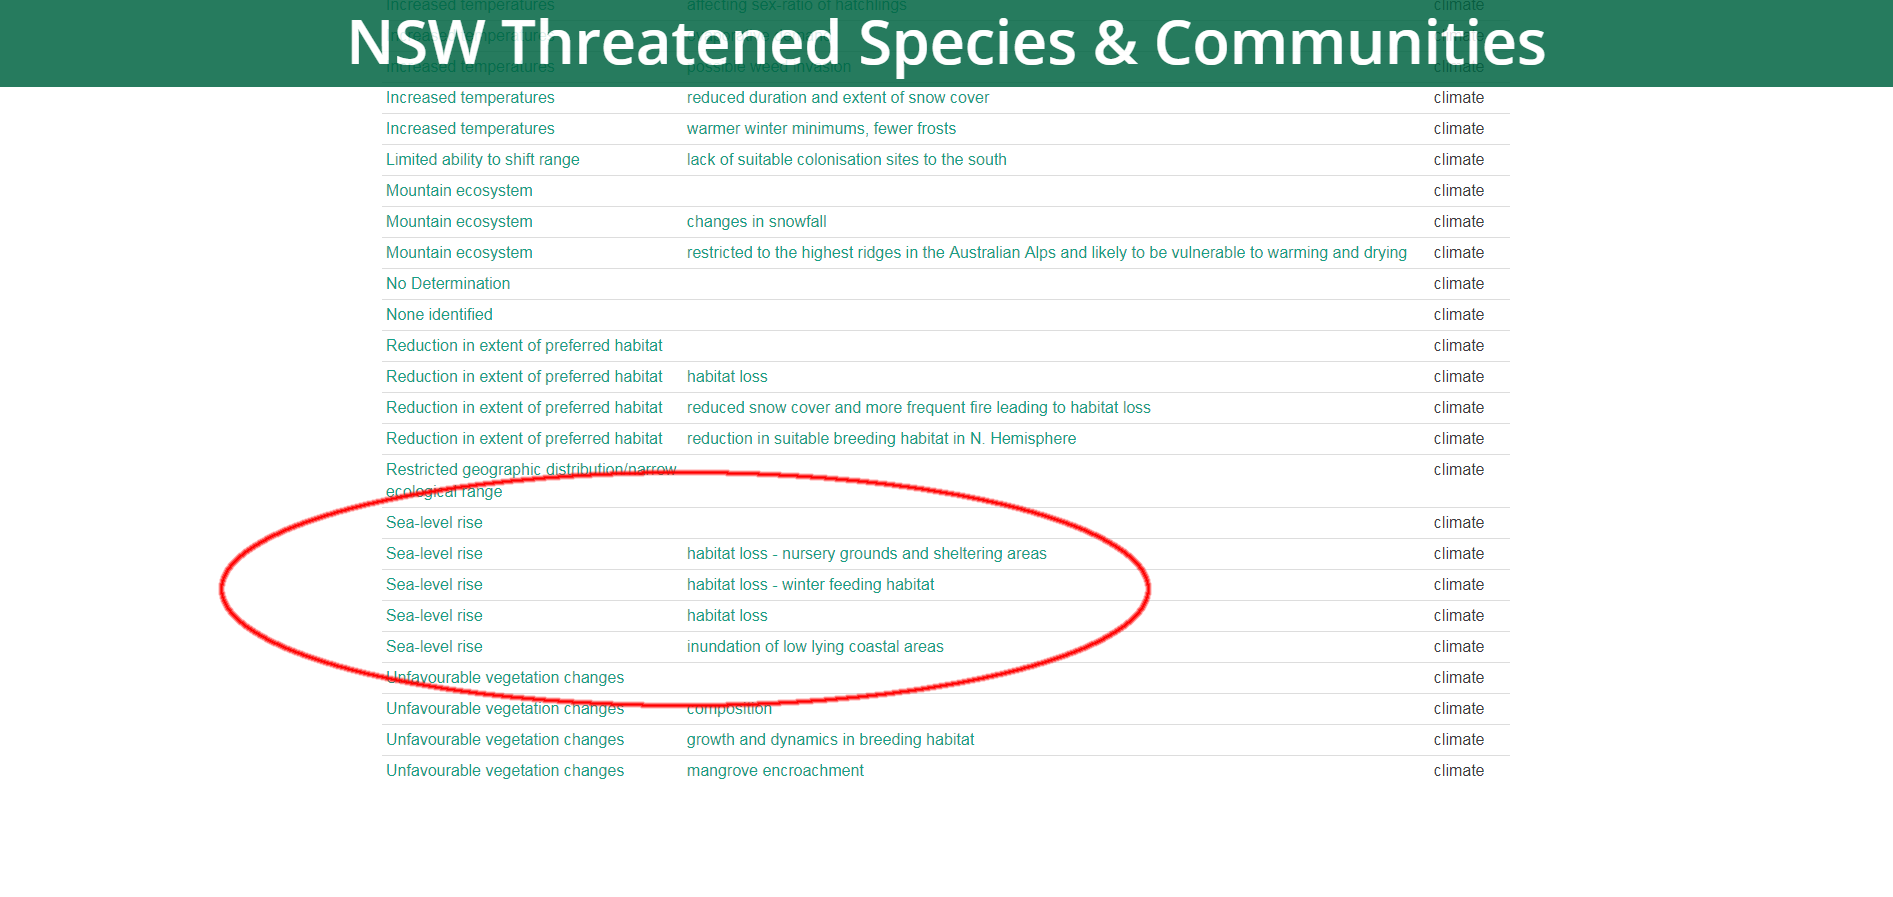
Figure 16. Climate change threats referencing "sea-level rise"